Up to this point, I have developed the various parts of the HumanProof software. The focus of this chapter is my study to investigate how mathematicians think about the understandability of proofs and to evaluate whether the natural language proofs generated by HumanProof aid understanding.
6.1. Objectives
This chapter addresses the third objective of Question 2 in my set of research questions (Section 1.2): evaluating HumanProof by performing a study on real mathematicians. Let me break this objective down into a number of hypotheses and questions.
The hypotheses that I wish to test are:
Users will (on average) rank HumanProof natural language proofs as more understandable than Lean proofs.
Users will (on average) rank HumanProof natural language proofs as less understandable than proofs from a textbook. This hypothesis is a control: a textbook proof has been crafted by a human for teaching and so I would expect it to be more understandable than automatically-generated proofs.
Users will (on average) be more confident in the correctness of a Lean proof.
In addition to testing these hypotheses, I wish to gather qualitative answers to the following two questions:
What properties of a proof contribute to, or inhibit, understandability?
How does having a computer-verified proof influence a mathematician's confidence in the correctness of the proof?
6.2. Methodology
The goal of this study is to evaluate the hypotheses and gain answers to the questions above.
To do this, I found a set of mathematicians and showed them sets of proof scripts written using Lean, HumanProof and a proof script taken from a mathematics textbook. I recorded the sessions and performed a qualitative analysis of the verbal responses given by participants. I also asked participants to score the proof scripts on a Likert scale (that is, rank from 1 to 5) according to two 'qualities':
How understandable are the proofs for the purpose of verifying correctness? This is to assess hypotheses 1 and 2.
How confident is the participant that the proofs are correct? Note that a proof assistant gives a guarantee of correctness. This is to assess hypothesis 3.
In Section 2.5, I discussed some of the literature in the definitions of understandability and distinguished between a person finding a proof understandable and a person being confident that a proof is correct. In this experiment, instead of using these definitions I asked the participants themselves to reflect on what understandable means to them in the context of the experiment.
A similar methodology of experimentation to the one presented here is the work of Jackson, Ireland and Reid [IJR99[IJR99]Ireland, Andrew; Jackson, Michael; Reid, GordonInteractive proof critics (1999)Formal Aspects of Computinghttps://doi.org/10.1007/s001650050052] in developing interactive proof criticsProof critics are discussed in Section 2.6.2.. Their study sought to determine whether users could productively interact with their software, and they adopted a co-operative evaluation methodology [MH93[MH93]Monk, Andrew; Haber, JeanneImproving your human-computer interface: a practical technique (1993)publisher Prentice Hallhttps://books.google.co.uk/books?id=JN9QAAAAMAAJ] where participants are asked to 'think aloud' when using their software.
In overview, each experiment session lasted about an hour and was split into three phases:
Participants were given a training document and a short presentation on how to read Lean proofs. They were also told the format of the experiment. (10 minutes)
Over 4 rounds, the participant was given a statement of a lemma in Lean code and then shown three proofs of the same lemma in a random order. They were asked to rate these and also to 'think aloud' about their reasons for choosing these ratings. (40 minutes)
A debrief phase, where 3 demographic questions were asked as well as a brief discussion on what understandability means to them. (5 minutes)
Due to the COVID19 pandemic, each experiment session was conducted using video conferencing software with the participants submitting ratings using an online form. As well as the data that the participants filled in the form with, the audio from the sessions was recorded and transcribed to methodically extract the explanations for why the participants assigned the ratings they did.
The study was ethically approved by the Computer Laboratory at the University of Cambridge before commencing. The consent form that participants were asked to sign can be found in Appendix D.4.
6.2.1. Population
I wish to understand the population of working mathematicians, which here means people who work professionally as mathematicians or students of mathematics or mathematical sciences such as physics. That is, people who are mathematically trained but who do not necessarily have experience with proof assistants.
Postgraduates and undergraduates studying mathematics at the University of Cambridge were recruited though an advert posted to the university's mathematics mailing list, resulting in 11 participants. The first participant was used in a pilot study, however the experiment was not changed in light of the results of the pilot and so was included in the main results. All participants were rewarded with a £10 gift card.
6.2.2. Choice of theorems to include
I will include proofs that involve all of the aspects of HumanProof discussed in Chapter 3 and Chapter 4. These are:
Natural language write-up (Section 3.6)
Branching on disjunctive goals (Section 3.5.6).
Advanced rule application automatically unrolling existential quantifiers (Section 3.5.8).
Subtasks engine for solving equalities (Chapter 4).
Note that the GUI developed in Chapter 5 was not included in this study. This is primarily due to the difficulty of performing user-interface studies remotely.
The proofs should be drawn from a context with which undergraduates and postgraduates are familiar and be sufficiently accessible that participants have ample time to read and consider the proofs. The four problems are:
The composition of group homomorphisms is a group homomorphism.
If
AandBare open sets in a metric space, thenA ∪ Bis also open.The kernel of a group homomorphism is a normal subgroup.
If
AandBare open sets in a metric space, thenA ∩ Bis also open.
Lemma 1 (g ∘ h is a group homomorphism) is simple but will be a 'teaching' question whose results will be discarded.
This serves to remove any 'burn-in' effects to do with participants misunderstanding the format of the experiment and to give the participant some practice.
6.2.3. Choice of proofs
The main part of the experiment is split into 4 tasks, one for each of the lemmas given above. Each task consists of
A theorem statement in natural language and in Lean. For example, Lemma 1 appears as "Lemma 1: the composition of a pair of group homomorphisms is a group homomorphism" and also
is_hom f → is_hom g → is_hom (g ∘ f).A brief set of definitions and auxiliary propositions needed to understand the statement and proof.
Three proof scripts;
A Lean tactic sequence, written so that it is not necessary to see the tactic state to understand the proof.
A HumanProof generated natural language write-up.
A natural language proof taken from a textbook.
These proofs can be viewed in Appendix D.3.
Both of the metric space problems use the same definitions, so this will save some time in training the participant with notation and background material. They also produce different HumanProof write-ups.
In Lemma 4 (Appendix D.3.4), the statement to prove is that the intersection of two open sets is open.
The HumanProof proof for this differs from the Lean and textbook proofs in that an existential variable ε : ℝ needs to be set to the minimum of two other variables.
In the Lean and textbook proofs, ε is explicitly assigned when it is introduced. But HumanProof handles this differently as discussed in Section 3.5.8: ε is transformed into a metavariables and is assigned after it can be deduced from unification later.
Two group theory problems (Lemmas 1 and 3) are given which are performed using a chain of equalities. These use the subtasks engine detailed in Chapter 4.
There are usually many ways of proving a theorem. Each of the three proofs for a given theorem have been chosen so that they follow the same proof structure, although the level of detail is different, and in the equality chains different sequences are used. This should help to ensure that the participant's scores are informed by the presentation of the proof, rather than the structure of the proof.
For all proofs, variable names were manually adjusted to be the same across all three proofs.
So for example, if HumanProof decides to label a variable ε but it is η in the textbook, ε is changed to be η.
Stylistic choices like this were arbitrated by me to be whichever choice I considered to be most conventional.
The study was originally intended to be face-to-face, showing users an on-screen Lean proof with the help of the Lean infoview to give information on the intermediate proof state. However, due to the study being remote, the material was presented using static images within a web-form instead. This meant that all of the proofs needed to be read without the help of any software. So I wrote the Lean proofs in a different style to the one that would be found in the Lean mathematics library. The following list gives these stylistic changes. I will discuss the validity implications of this in Section 6.7.
All variable introductions had their types explicitly written even though Lean infers them.
Before and after a complex tactic I insert a
show Gstatement with the goal being shown.French quotes
‹x ∈ A›to refer to proofs are used wherever possible (as opposed to usingassumptionor the variable name for the proof).When proving
A ∪ Bis open, one needs to perform case analysis ony ∈ A ∪ Bwhere the reasoning for either case is very similar. While it is possible to use awlogtactic to reduce the size of the proof, I decided against using it because one must also provide an auxiliary proof for converting the proof on the first case to the second case.
In the textbook proof all was replaced with Lean-style pretty printed expressions. This is to make sure that the participants are not biased towards the human-made proof due to their familiarity with -style mathematical typesetting. Another issue with the metric space proofs is that the original textbook proofs that I found were written in terms of open balls around points, but I wanted to keep the definitions used by the proofs as similar as possible so I used ∀,∃-style arguments. Thus the parts of the textbook proofs that mention open balls were replaced with the equivalent ∀,∃ definition. This might have caused the textbook proofs to become less understandable than the original. This concern is revisited in Section 6.7.
6.3. Agenda of experiment
In this subsection I provide more detail on the design and structure of my empirical study. The session for each participant was designed to take less than an hour and be one-to-one over Zoom, a video conferencing application. Zoom was also used to schedule and record the sessions.
6.3.1. Pre-session
Before the session starts, a time is scheduled and participants are asked to sign a consent form which may be viewed in Appendix D.4. This consent form makes sure that the participants are aware of and accept how the data generated from the session will be used. Namely, I record their names and emails, however only the anonymised answers to the forms and some selected quotes are publicly released. All recording data and identification data were deleted after the course of the experiment.
6.3.2. Preparatory events
Once the session starts, I greet the participant, double-check that they have signed the consent form and give them an overview of the agenda of the study. I also remind them that their mathematical ability is not being tested.
6.3.3. Training phase
In this phase, the training document given in Appendix D.2 is sent to the participant as a PDF, and the participant is asked to share their screen with me so that I can see the training document on their desktop. Participants were told that the purpose of the training document was to get them familiar enough with the new syntax so that they could read through a Lean proof and understand what is being done, even if they might not be able to write such a proof.
Then I walk the participant through the training document, answering any questions they have along the way. The purpose of the training document is to get the participant used to the Lean syntax and tactic framework.
For example, the right associativity of function/implication arrows f : P → Q → R and the curried style of function application (f p q versus f(p,q)).
The final part of the training document is a reference table of tactics.
Participants are informed that this table is only for reference and that it is covered in the training phase.
The training phase is designed to take around 10 to 15 minutes.
The participant is informed that they can refer back to this training document at any time during the experiment, although in the name of reducing browser-tab-juggling, I would also offer to verbally explain any aspects of the material that participants were unsure about.
6.3.4. Experiment phase
After the training phase, I ask the participant if I can start recording their screen and send them a link to a Google Form containing the material and questions for phases 2 and 3.
The first page of the form is a landing page with some checkboxes to double check that the participant is ready, has signed the consent form, and understands the format of the experiment.
The participant then proceeds to the first in a sequence of four pages. Each page contains a lemma, some necessary definitions, a set of three proofs and two sets of Likert scale radio buttons for the participant to rate their understandability and confidence scores for each proof. The lemmas are presented in a random order, although the first lemma - the composition of two group homomorphisms is a group homomorphism - always appears first because it is used to counter the learning effect as discussed in Section 6.2.2. The proofs are also presented in a random order on the page.
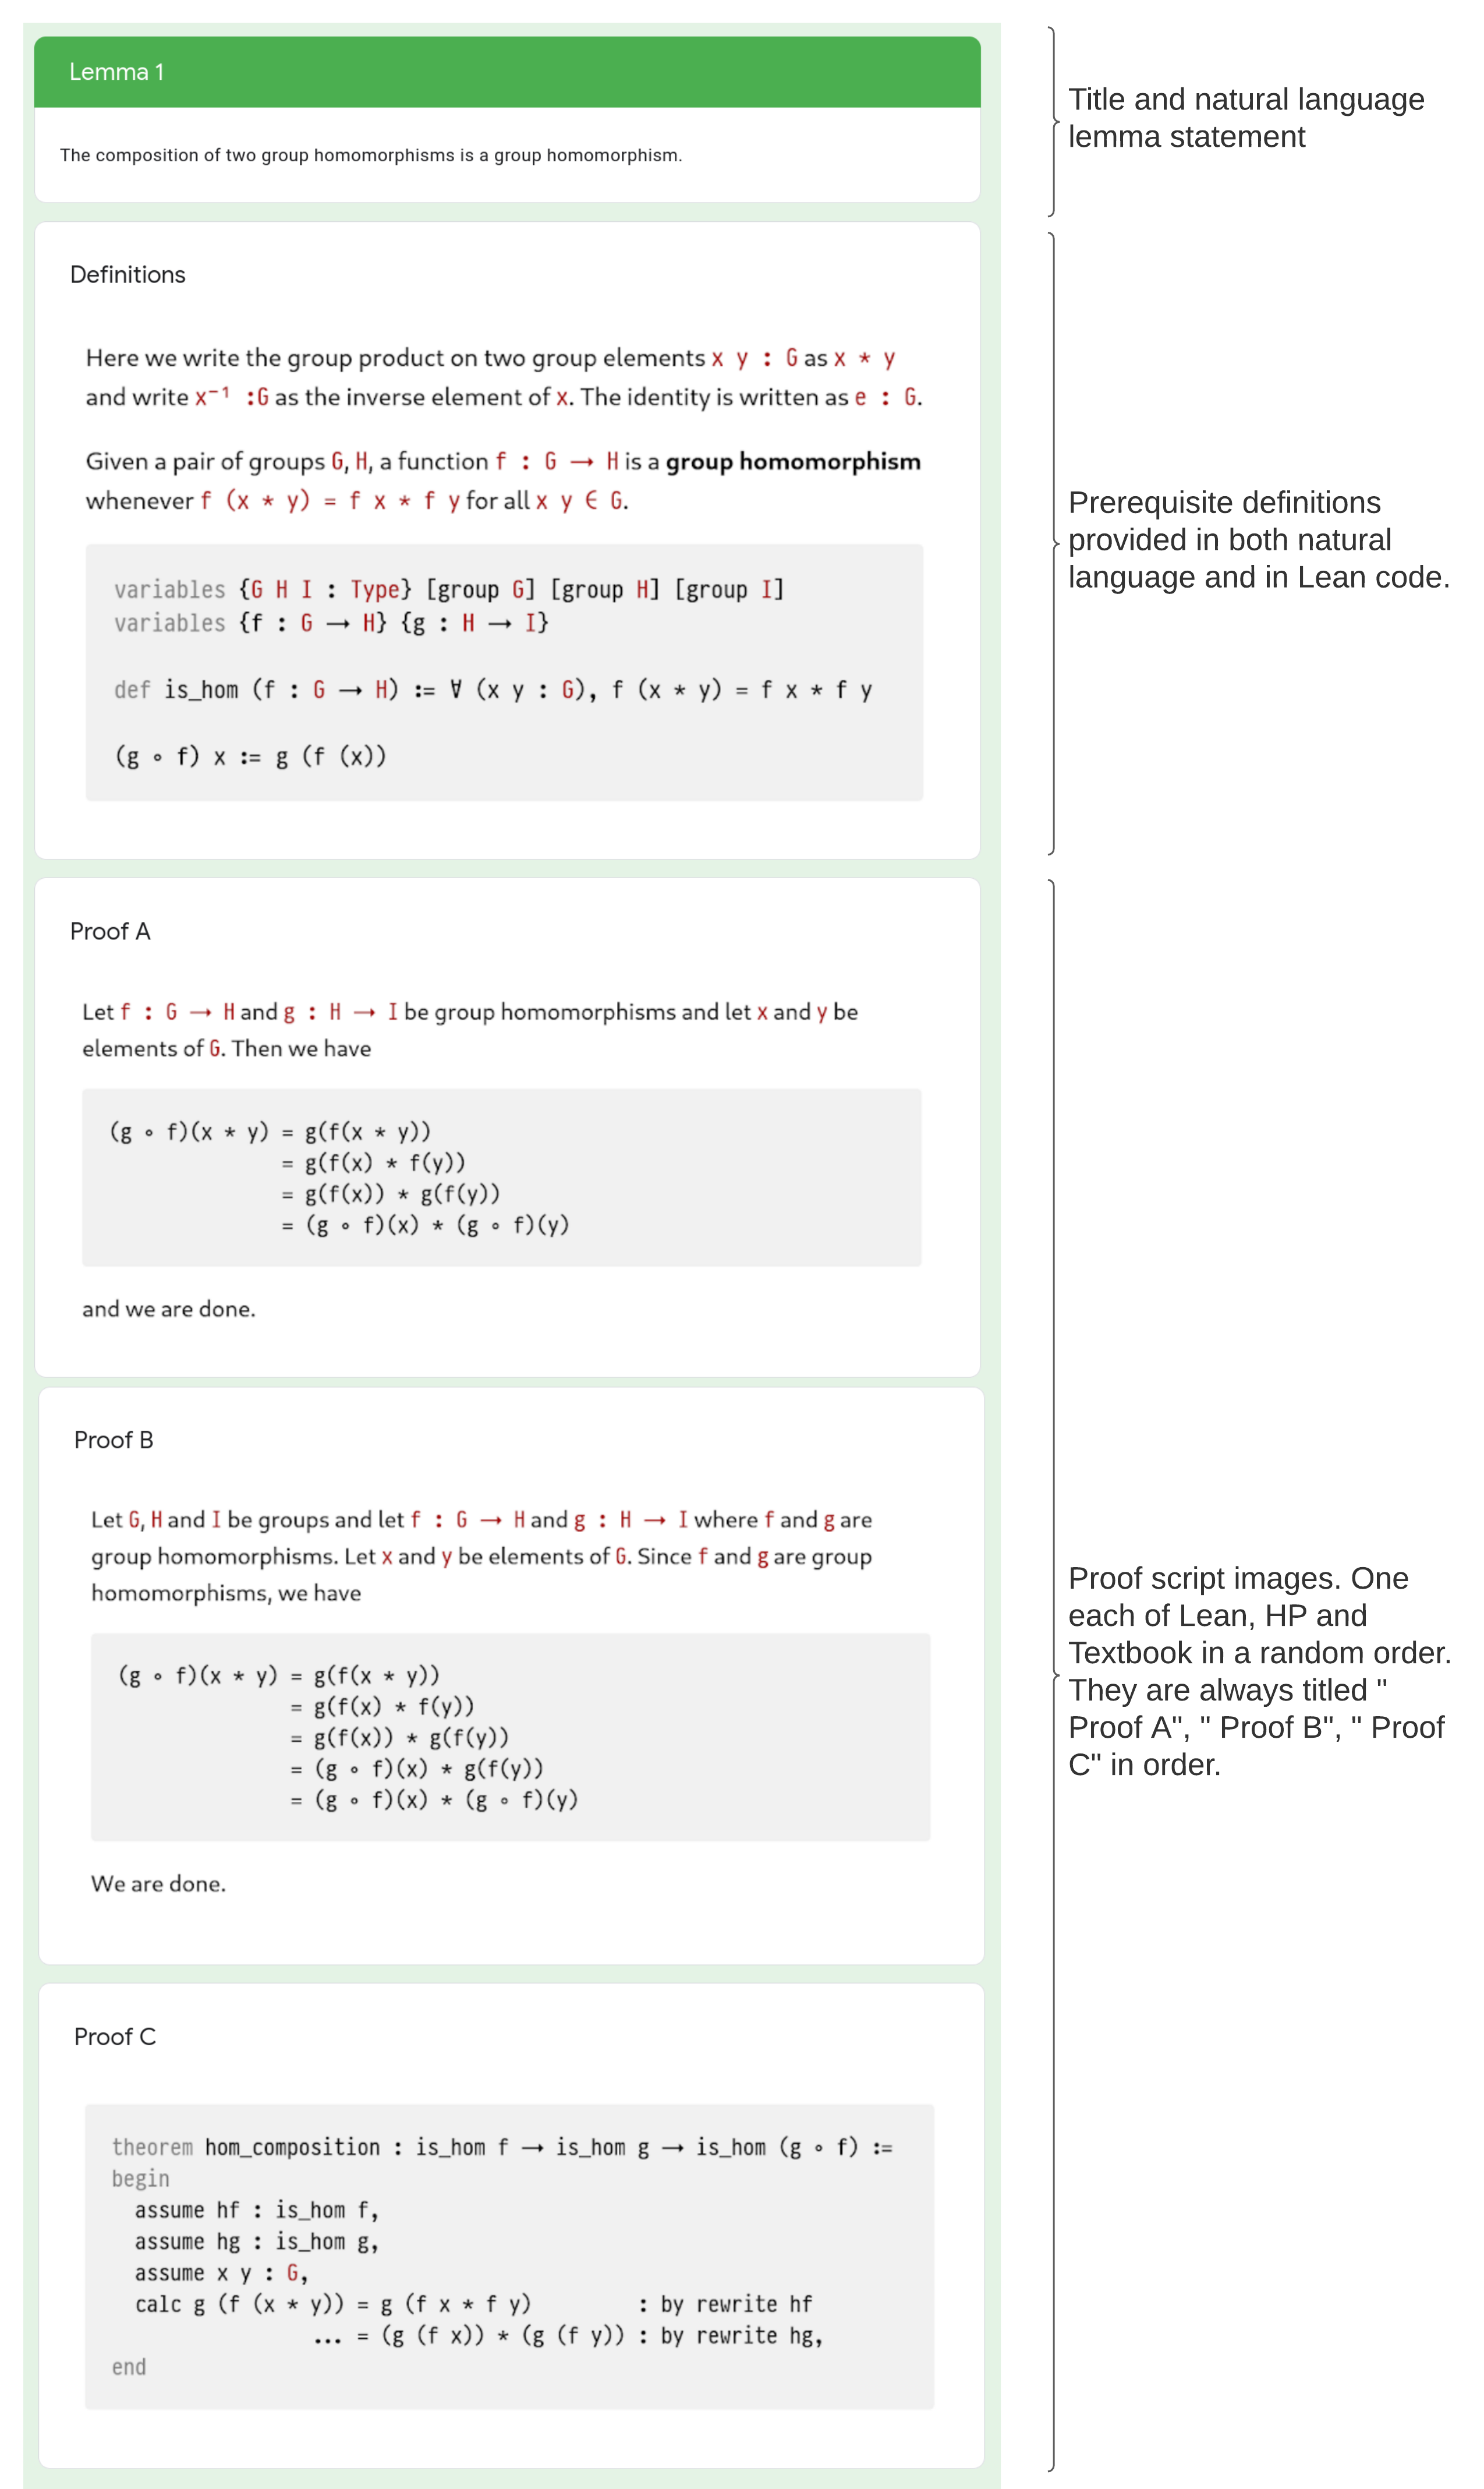
The form page given for each task is presented in Figure 6.1, each page is laid out in a vertical series of boxes, the first box contains the lemma number and the statement of the lemma to be proven. The next box contains the definitions, written in both natural language and Lean syntax. Then come three boxes containing the proof scripts in a random order. Each proof script is presented as a PNG image to ensure that the syntax and line-breaks render the same on all browsers and screen sizes.
Annotated overview of a task page in Google forms. The content present in the form can be read in full in Appendix D.3.
At the bottom of the page, participants were presented with two more boxes containing a set of radio buttons allowing the participant to rate each proof as shown in Figure 6.2.
A filled out form.
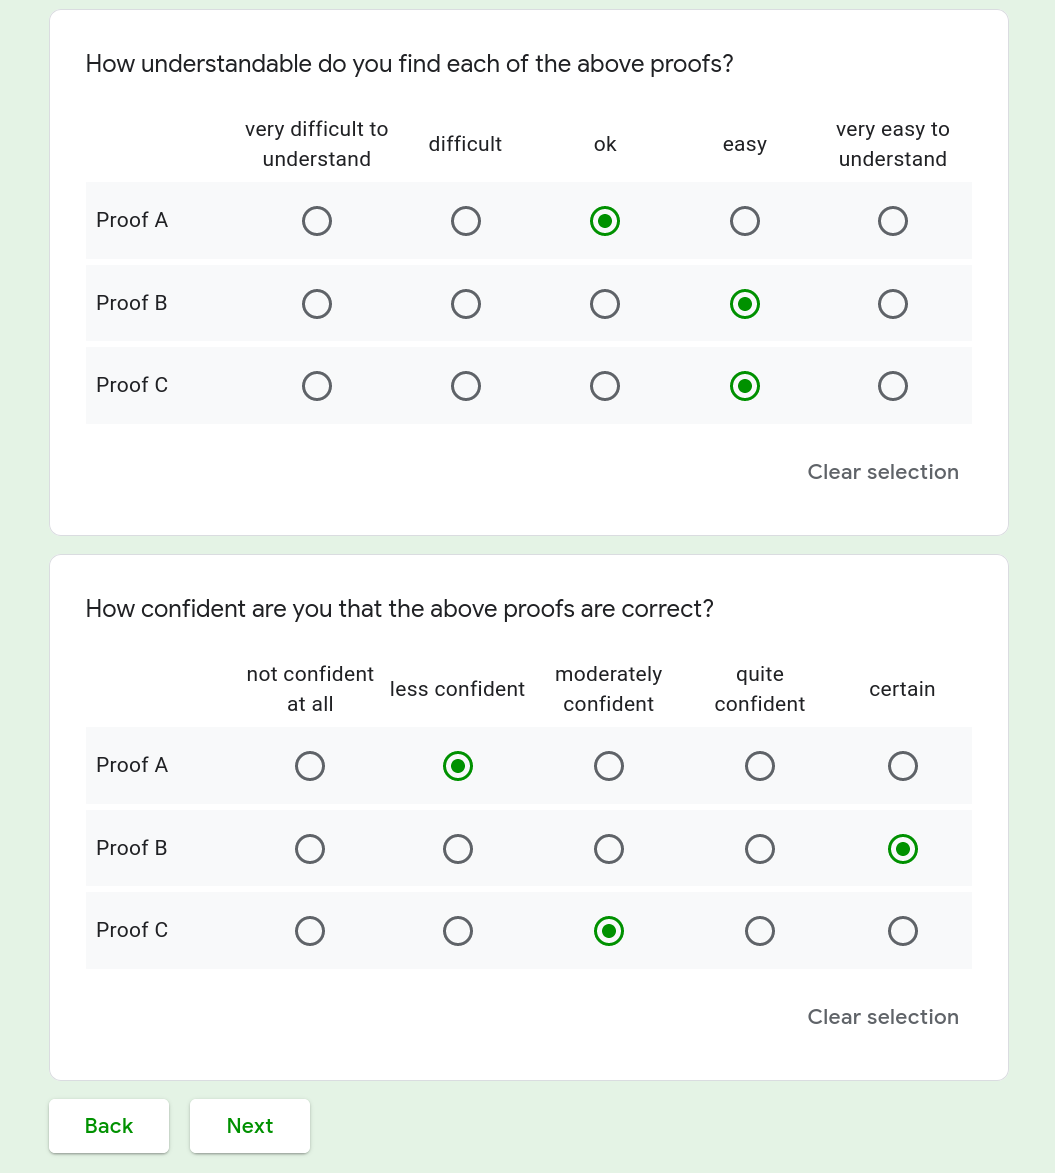
The title questions for these sets of buttons are "How understandable do you find each of the above proofs?" and "How confident are you that the above proofs are correct?". Each column of the radio buttons has a phrase indicating the Likert scoring level that that column represents.
The participants were reminded that:
They could assume that the Lean proof was valid Lean code and had been checked by Lean.
That the confidence measure should not be about the confidence in the result itself being true but instead confidence that the proof given actually proves the result.
The interpretation of the concept of 'understandable' is left to the participant.
Once the participant filled out these ratings, I would prompt them to give some explanation for why they had chosen these ratings - although usually they would volunteer this information without prompting. In the case of a tie, I also asked how they would rank the tied items if forced to choose.
If I got the impression that the participant was mixing up the labels during the rating phase, I planned to interject about the label ordering. This did not occur in practice though.
6.3.5. Debriefing phase
In this final phase, the user is presented with a series of multiple choice questions. Namely;
What is the level of education that you are currently studying? (Undergraduate 1st year, Undergraduate 2nd year, Undergraduate 3rd year, Masters student, PhD student, Post-doc and above, Other)
Which of the below labels best describes your area of specialisation? (Pure Mathematics, Applied Mathematics, Theoretical Physics, Statistics, Computer Science, Other)
How much experience with automated reasoning or interactive theorem proving do you have? (None, Novice, Moderate, Expert)
Finally, there is a text-box question entitled "What does it mean for a proof to be 'understandable' to you?". At this point, I would tell the participant that they could also answer verbally and I would transcribe their answer.
After the participant has submitted the form, I thanked them and stoped recording. In some cases, the participant wanted to know more about interactive theorem proving and Lean, and in this case I directed them towards Kevin Buzzard's Natural Numbers Game.
6.4. Results
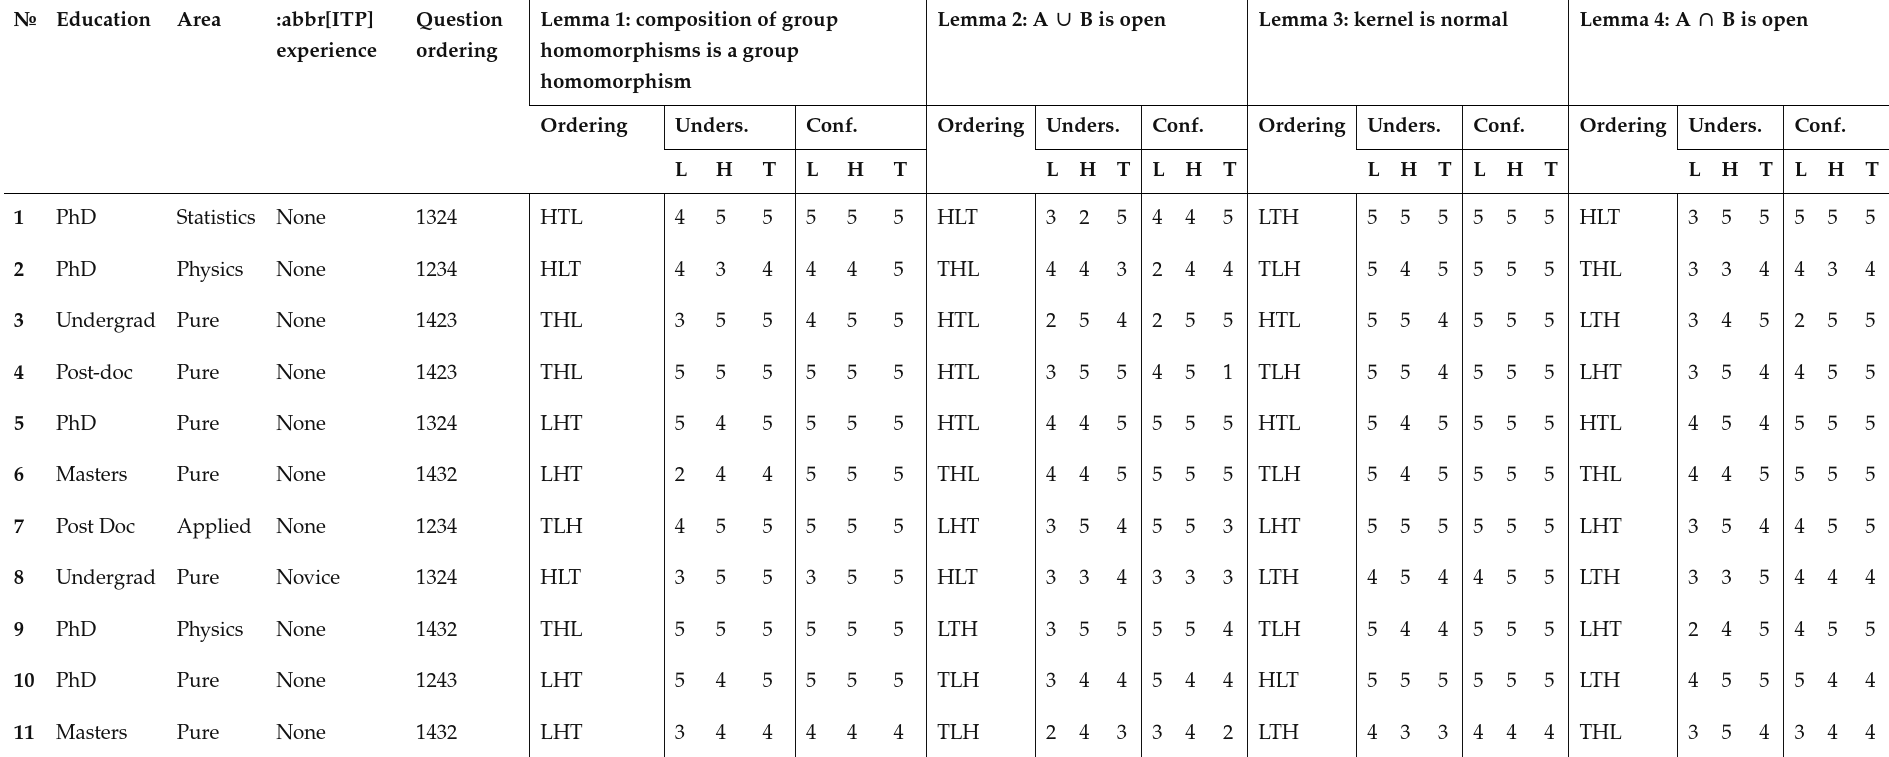
Full results are given in Table 6.3. In the remainder of this section the proof scripts are coded as follows:
L is the Lean proof; H is the natural language HumanProof-generated proof; T is the textbook proof.
Similarly, the lemmas are shortened to their number (i.e., "Lemma 2" is expressed as "2"). The 'Question ordering' and 'Ordering' columns give the order in which the participant saw the lemmas and proofs respectively.
So an ordering of 1432 means that they saw Lemma 1, then Lemma 4, then 3, then 2. And within a lemma, an ordering of HTL means that they saw the HumanProof proof followed by textbook proof, followed by the Lean proof.
The columns are always arranged in the LHT order, so the L column is always the rating that they assigned to the Lean proof.
'Unders.' and 'Conf.' are the understandability and confidence qualities, respectively. Figure 6.4 and Figure 6.5 plot these raw results as bar charts with various groupings.
These results are interpreted and analysed in Section 6.5.
The full (anonymised) results table of the quantitative data collected from the experiment. Print note: a full, selectable version of this table can be found at https://www.edayers.com/thesis/evaluation#full-results-table.
| № | Education | Area | ITP experience | Question ordering | Lemma 1: composition of group homomorphisms is a group homomorphism | Lemma 2: A ∪ B is open | Lemma 3: kernel is normal | Lemma 4: A ∩ B is open | ||||||||||||||||||||||||
|---|---|---|---|---|---|---|---|---|---|---|---|---|---|---|---|---|---|---|---|---|---|---|---|---|---|---|---|---|---|---|---|---|
| Ordering | Unders. | Conf. | Ordering | Unders. | Conf. | Ordering | Unders. | Conf. | Ordering | Unders. | Conf. | |||||||||||||||||||||
| L | H | T | L | H | T | L | H | T | L | H | T | L | H | T | L | H | T | L | H | T | L | H | T | |||||||||
| 1 | PhD | Statistics | None | 1324 | HTL | 4 | 5 | 5 | 5 | 5 | 5 | HLT | 3 | 2 | 5 | 4 | 4 | 5 | LTH | 5 | 5 | 5 | 5 | 5 | 5 | HLT | 3 | 5 | 5 | 5 | 5 | 5 |
| 2 | PhD | Physics | None | 1234 | HLT | 4 | 3 | 4 | 4 | 4 | 5 | THL | 4 | 4 | 3 | 2 | 4 | 4 | TLH | 5 | 4 | 5 | 5 | 5 | 5 | THL | 3 | 3 | 4 | 4 | 3 | 4 |
| 3 | Undergrad | Pure | None | 1423 | THL | 3 | 5 | 5 | 4 | 5 | 5 | HTL | 2 | 5 | 4 | 2 | 5 | 5 | HTL | 5 | 5 | 4 | 5 | 5 | 5 | LTH | 3 | 4 | 5 | 2 | 5 | 5 |
| 4 | Post-doc | Pure | None | 1423 | THL | 5 | 5 | 5 | 5 | 5 | 5 | HTL | 3 | 5 | 5 | 4 | 5 | 1 | TLH | 5 | 5 | 4 | 5 | 5 | 5 | LHT | 3 | 5 | 4 | 4 | 5 | 5 |
| 5 | PhD | Pure | None | 1324 | LHT | 5 | 4 | 5 | 5 | 5 | 5 | HTL | 4 | 4 | 5 | 5 | 5 | 5 | HTL | 5 | 4 | 5 | 5 | 5 | 5 | HTL | 4 | 5 | 4 | 5 | 5 | 5 |
| 6 | Masters | Pure | None | 1432 | LHT | 2 | 4 | 4 | 5 | 5 | 5 | THL | 4 | 4 | 5 | 5 | 5 | 5 | TLH | 5 | 4 | 5 | 5 | 5 | 5 | THL | 4 | 4 | 5 | 5 | 5 | 5 |
| 7 | Post Doc | Applied | None | 1234 | TLH | 4 | 5 | 5 | 5 | 5 | 5 | LHT | 3 | 5 | 4 | 5 | 5 | 3 | LHT | 5 | 5 | 5 | 5 | 5 | 5 | LHT | 3 | 5 | 4 | 4 | 5 | 5 |
| 8 | Undergrad | Pure | Novice | 1324 | HLT | 3 | 5 | 5 | 3 | 5 | 5 | HLT | 3 | 3 | 4 | 3 | 3 | 3 | LTH | 4 | 5 | 4 | 4 | 5 | 5 | LTH | 3 | 3 | 5 | 4 | 4 | 4 |
| 9 | PhD | Physics | None | 1432 | THL | 5 | 5 | 5 | 5 | 5 | 5 | LTH | 3 | 5 | 5 | 5 | 5 | 4 | TLH | 5 | 4 | 4 | 5 | 5 | 5 | LHT | 2 | 4 | 5 | 4 | 5 | 5 |
| 10 | PhD | Pure | None | 1243 | LHT | 5 | 4 | 5 | 5 | 5 | 5 | TLH | 3 | 4 | 4 | 5 | 4 | 4 | HLT | 5 | 5 | 5 | 5 | 5 | 5 | LTH | 4 | 5 | 5 | 5 | 4 | 4 |
| 11 | Masters | Pure | None | 1432 | LHT | 3 | 4 | 4 | 4 | 4 | 4 | TLH | 2 | 4 | 3 | 3 | 4 | 2 | LTH | 4 | 3 | 3 | 4 | 4 | 4 | THL | 3 | 5 | 4 | 3 | 4 | 4 |
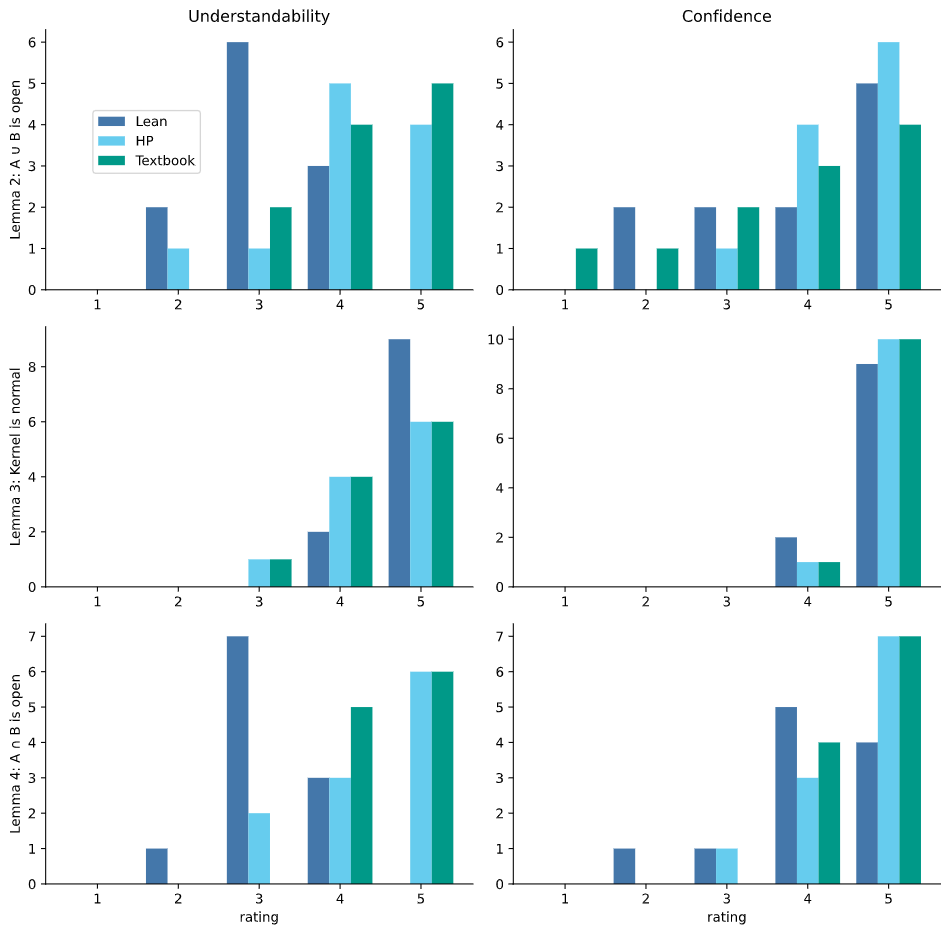
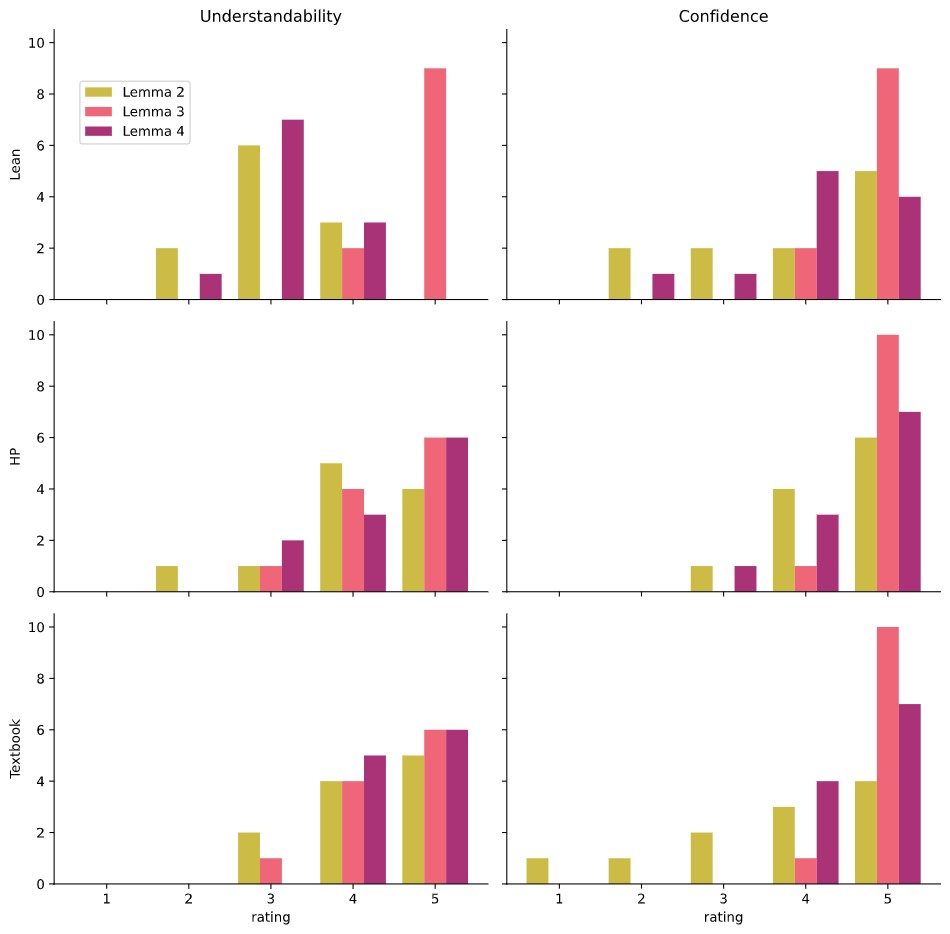
Bar chart of the ratings grouped by lemma. That is, each row is a different lemma and for each of the values [1,5] the number of people who assigned that rating are plotted as a bar, with a different colour for each of the proofs. The columns correspond to the two 'qualities' that the participants rated understandability and confidence.
Bar chart of the ratings grouped by proof. The same data is used as in Figure 6.4 but with separate vertical plots for each of the types.
6.5. Quantitative analysis of ratings
6.5.1. Initial observations
On all the lemmas, people on average ranked the understandability of HumanProof and Textbook proofs to be the same. On Lemma 3, people on average ranked the Lean proof as more understandable than the HumanProof and Textbook proofs. But on Lemmas 2 and 4, they on average ranked understandability of the Lean proof to be less than the HumanProof and Textbook proofs. For participants' confidence in the correctness of the proof, the participants were generally certain of the correctness of all of the proofs. On Lemma 2, confidence was ranked Textbook < HumanProof < Lean. On Lemma 3 the confidence was almost always saturated at 5 for all three proofs, meaning that this result had a ceiling effect. On Lemma 4, confidence was ranked Lean < HumanProof < Textbook.
6.5.2. Likelihood of preferences
Now consider the hypotheses outlined in Section 6.1. There are not enough data to use advanced models like ordinal regression, but we can compute some simple likelihood curves for probabilities of certain propositions of interest for a given participant.
Let's find a likelihood curve for the probability that some participant will rank proof above proof , where and are from the set . Fixing a statistical model with parameters and dataset , define the likelihood as a function of proportional to the probability of seeing the data given parameters .
Take a pair of proofs and a fixed lemma and quality . Write to be the number of data in the dataset that evaluate to true. Hence from the data we get three numbers , and . In the case of a tie , let's make the assumption that the participants 'true preference' is either or , but that them reporting a tie means that the result could go either way. So let's model the proposition that for a random mathematician being drawn from a Bernoulli distribution with parameter . For example, if the true value for was 0.4 for on Lemma 2, we would expect a new participant to rank Lean below Textbook 40% of the time and Textbook below Lean 60% of the time. Our goal is to find a likelihood function for given the data. We can write this as
How to implement ? The assumption above tells us to break ties randomly. So that means that if there is one tie, there is a 50% chance of that being evidence for or 50% for . Hence
Plotting the normalised likelihood curves for for each lemma, quality and pair of proofs is shown in Figure 6.8.
Normalised likelihood curves for the probability that a random mathematician will rate A less then B for a given lemma and quality. Note that each plot has a different scale, what matters is where the mass of the distribution is situated. This plot is analysed in Section 6.5.3.
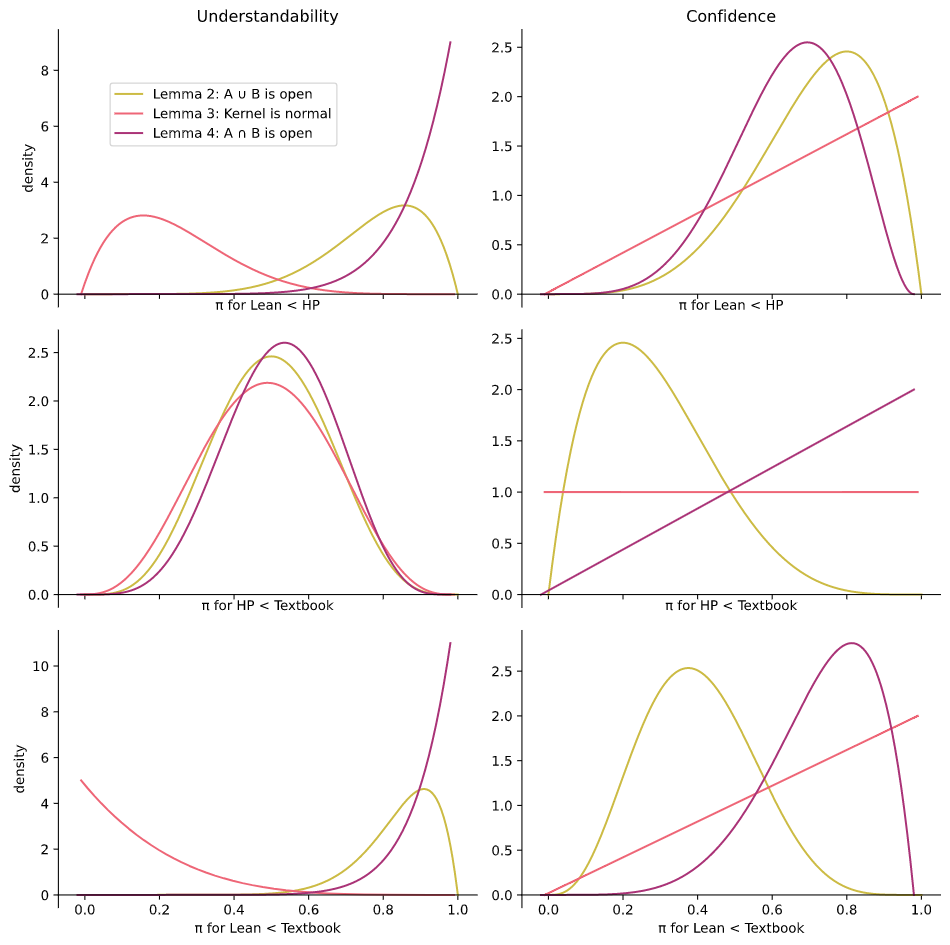
Each curve has been scaled to have an area of . However each of the six plots have a different y-axis scaling to make the shapes as clear as possible. These graphs encapsulate everything that the data can tell us about each independent . We can interpret them as telling us how to update our prior to a posterior . A curve skewed to the right for means that it is more likely that a participant will rank above . A curve with most of the mass in the center means that participants could rank and either way.
In the confidence plot for (mid right of Figure 6.8), the horizontal line for "kernel is normal" means that the given data tell us nothing about whether users prefer HumanProof or the Textbook proof. Consulting the raw data in Table 6.3, we can see that all 11 participants ranked these proofs equally, so the data can't tell us anything about which one they would really prefer if they had to choose a strict ordering.
6.5.3. Testing the hypotheses
We can interpret the likelihood curves in Figure 6.8 to test the three hypotheses given in Section 6.1. Each of the hypotheses takes the form of a comparison between how the participants ranked pairs of proof script types. The external validity of the conclusions (i.e., do the findings tell us anything about whether the hypothesis is true in general?) is considered in Section 6.7.
For the first hypothesis, I ask whether HumanProof natural language proofs are rated as more understandable than Lean proofs. The top left plot comparing the ratings of Lean to HumanProof proofs in Figure 6.8 contains the relevant likelihoods. To convert each of these likelihood functions on in to a posterior distribution , first multiply by a prior since . In the following analysis I choose a uniform prior .
One way to answer the hypothesis is to take each posterior and compute the area under the curve where . This will be the prior probability that the statement "HumanProof natural language proofs is preferred" for that particular lemma. The full set of these probabilities are tabulated in Table 6.9.
1. The participants ranked HumanProof natural language proofs as more understandable than Lean proofs. (The top-left plot in Figure 6.8.)
Reading this gives a different conclusion for Lemma 3Lemma 3: the kernel of a group homomorphism is a normal subgroup (Appendix D.3.3). versus Lemmas 2 and 4Lemma 2: If A and B are open then A ∪ B is open (Appendix D.3.2). Lemma 4: If A and B are open then A ∩ B is open (Appendix D.3.4).. For Lemma 3, we can see that users actually found the Lean proof to be more understandable than the natural language proofs , we will see some hints as to why in Section 6.6.2. For Lemmas 2 and 4: and of the mass is above .
2. The participants rank HumanProof natural language proofs as less understandable than proofs from a textbook. (The middle-left plot in Figure 6.8.) For all three lemmas a roughly equal amount of the area is either side of , suggesting that participants do not have a rating preference of textbook proofs versus HumanProof proofs for understandability. Hence there is no evidence to support hypothesis 2 from this experiment. As will be discussed in Section 6.7, I suspect that finding evidence for hypothesis 2 requires longer, more advanced proofs.
3. The participants are more confident in the correctness of a Lean proof to the natural language-like proofs. (The top-right and bottom-right plots in Figure 6.8.) For Lemma 3: the straight line indicates that only one participant gave a different confidence score for the proofs. As such a significant amount of the area lies on either side of , and so the evidence is inconclusive. For Lemma 2: we have an 89% chance that they are more confident in HumanProof over Lean and a 25% chance that they are more confident in Textbook over Lean. So this hypothesis resolves differently depending on whether it is the HumanProof or Textbook proofs. Finally with Lemma 4: the numbers are 85% and 94%, so the hypothesis resolves negatively; on Lemma 4 we should expect mathematicians to be more confident in the natural-language-like proofs, even though there is a guarantee of correctness from the Lean proof. The verbal reasons that participants gave when justifying this choice are explored in Section 6.6.1.
A table of probabilities for whether a new participant will rank for different pairs of proof scripts. As detailed in Section 6.5.2 and Section 6.5.3, these numbers are found by computing on a uniform prior . For a fixed , and quality : is the parameter of a Bernoulli distribution modelling the probability that a particular participant will rate for .
| Understandability | Confidence | ||
|---|---|---|---|
| p(Lean < HumanProof) | Lemma 2 | 96% | 89% |
| Lemma 3 | 6% | 75% | |
| Lemma 4 | 99.8% | 85% | |
| p(HumanProof < Textbook) | Lemma 2 | 50% | 11% |
| Lemma 3 | 50% | 50% | |
| Lemma 4 | 62% | 75% | |
| p(Lean < Textbook) | Lemma 2 | 99.7% | 25% |
| Lemma 3 | 3% | 75% | |
| Lemma 4 | 99.95% | 94% | |
So here, we can see that how the hypotheses resolve are dependent on the lemma in question. In order to investigate these differences, let us now turn to the verbal comments and responses that participants gave during each experiment session.
6.6. Qualitative analysis of verbal responses
In this section, I seek answers to the questions listed in Section 6.1. That is, what do the participants interpret the word 'understandable' to mean and what are their reasons for scoring the proofs as they did?
Schreier's textbook on qualitative content analysis [Sch12[Sch12]Schreier, MargritQualitative content analysis in practice (2012)publisher SAGE Publicationshttps://uk.sagepub.com/en-gb/eur/qualitative-content-analysis-in-practice/book234633] was used as a reference for determining the methodology here. There are a few different techniques in sociology for qualitative analyses: 'coding', 'discourse analysis' and 'qualitative content analysis'. The basic idea in these is to determine the kinds of responses that would help answer ones research question (coding frame) and then systematically read the transcripts and categorise responses according to this coding frame.
To analyse the verbal responses, I transcribed the recordings of each session and segmented them into sentences or sets of closely related sentences. The sentences that expressed a reason for a preference between the proofs or a general comment about the understandability were isolated and categorised. If the same participant effectively repeated a sentence for the same Lemma, then this would be discarded.
6.6.1. Verbal responses on understandability
In the debriefing phase, participants gave their opinions on what it means for a proof to be understandable. I have coded these responses into four categories.
Syntax: features pertaining to the typesetting and symbols used to present the proof.
Level of detail (LoD): features to do with the amount of detail shown or hidden from the reader, for example, whether or not associativity steps are presented in a calculation. Another example is explicitly vs. implicitly mentioning that
A ⊆ A ∪ B.Structure: features to do with the wider layout of the arguments and the ordering of steps in the proof. I also include here the structure of exposition. So for example, when picking a value for introducing an exists statement, is the value fixed beforehand and then shown to be correct or is it converted to a metavariable to be assigned later?
Signposting: features to do with indicating how the proof is going to progress without actually performing any steps of the proof, for example, explaining the intuition behind a proof or pausing to restate the goal.
Other: anything else.
The presence of the 'other' category means that these codings are exhaustive. But are they mutually exclusive? We can answer this by comparing the categories pairwise:
Syntax/LoD: An overlap here would be a syntactic device which also changes the level of detail. There are a few examples of this which are supported by Lean: implicit argumentsFor example, for the syntax representing a group product
𝑎 * 𝑏, the carrier group is implicit. and castingIn0.5 + 1, the1is implicitly cast from a natural number to a rational number.. Both casting and implicit arguments hide unnecessary detail from the user to aid understanding. However since these devices are used by both Lean and natural language proofs they shouldn't be the reason that one is preferred over the other.Syntax/Structure: the larger layout of a proof document could be mediated by syntax such as
begin/endblocks, but here a complaint on syntax would be a complaint against the choices of token used to represent the syntax. If the comment is robust to changing the syntax for another set of tokens, then it is not a comment about the syntax.Syntax/Signposting: similarly to Syntax/Structure, signposting has syntax associated with it, but we should expect any issue with signposting to be independent of the syntax used to denote it.
LoD/Structure: LoD is different to structure in that if a comment is still valid after adding or removing detail (e.g., steps in an equality chain or an explanation for a particular result) then it is not a comment about LoD.
LoD/Signposting: There is some overlap between LoD and signposting, because if a signpost is omitted, then this could be considered changing the level of detail. However I distinguish them by stipulating that signposts are not strictly necessary to complete the proof, whereas the omitted details are necessary but are not mentioned.
Structure/Signposting: Similarly to LoD/Signposting, signposts can be removed while remaining a valid proof.
The verbal answers to the meaning of understandability are coded and tabulated in Table 6.10.
Verbal responses prompted by 'What does it mean for a proof to be understandable to you?'. Each phrase in the first column is paraphrased to be a continuation of 'A proof is understandable when...'.
| A proof is understandable when ... | count | category |
|---|---|---|
| "it provides intuition or a sketch of the proof" | 6 | signposting |
| "it clearly references lemmas and justifications" | 4 | level of detail |
| "it emphasises the key difficult steps" | 4 | signposting |
| "each step is easy to check" | 3 | level of detail |
| "it is aimed at the right audience" | 3 | other |
| "it allows you to easily reconstruct the proof without remembering all of the details" | 2 | structure |
| "it hides bits that don't matter" (for example, associativity rewrites) | 2 | level of detail |
| "it explains the thought process for deriving 'inspired steps' such as choosing ε" | 2 | structure |
| "it is clear" | 1 | syntax, structure |
| "it is concise" | 1 | syntax, structure |
| "it has a balance of words and symbols" | 1 | syntax |
Additionally, 4 participants claimed that just being easy to check does not necessarily mean that a proof is understandable. So the data show that signposting and getting the right level of detail are the most important aspects of a proof that make it understandable. The syntax and structure of the proof mattered less in the opinion of the participants.
6.6.2. Reasons for rating proofs in terms of understandability
Now I turn to the two qualitative questions asked in Section 6.1:
What properties of a proof contribute to, or inhibit, understandability?
How does having a computer-verified proof influence a mathematician's confidence in the correctness of the proof?
In order to answer these, we need to find general reasons why respondents ranked certain proofs above others on both the understandability and confidence quality.
The main new category to introduce here is whether the participants' reasons for choosing between the proofs are an intrinsic part of the proof medium or a presentational choice that can be fixed easily. For example, it may be preferred to skip a number of steps in an equality calculation, but it might be awkward to get this to verify in Lean in a way that might not be true for smaller proofs.
Since the numerical results for the metric space lemmas tell a different story to the group theory lemma, I separate the analysis along these lines.
For the group homomorphism question, the Lean proof was usually preferred in terms of understandability to the HumanProof and textbook proofs.
The main reasons given are tabulated in Table 6.11. I write H+ or L- and so on to categorise whether the comment is a negative or positive opinion on the given proof. So T+ means that the quote is categorised as being positive about the textbook proof.
Write = to mean that the statement applies to all of the proofs.
Table of reasons participants gave for their ranking of the understandability of proofs for Lemma 3.
| paraphrased quote | count | category | judgement | |
|---|---|---|---|---|
| 1 | "I would rather thatf (g * k * g⁻¹) = f g * f k * (f g)⁻¹ be performed in one step" | 2 | level of detail | L- |
| 2 | "I would rather thatf (g * k * g⁻¹) = f g * f k * (f g)⁻¹ be performed in two steps" | 2 | level of detail | L+ |
| 3 | "I like how the HumanProof proof does not need to apply(f g)⁻¹ = f (g⁻¹)" | 2 | structure | H+ |
| 4 | "I prefer the Lean proof because it explains exactly what is happening on each step with therewrite tactics" | 2 | level of detail | L+ |
| 5 | "I don't like how none of the proofs explicitly state that provingf (g * k * g⁻¹) = e implies that the kernel is therefore normal" | 2 | level of detail | = |
| 6 | Express a lack of difference between the proofs of Lemma 3 | 2 | structure | = |
| 7 | "The textbook proof is too hard to read because the equality chain is all placed on a single line" | 2 | syntax, level of detail | T- |
| 8 | "In the textbook proof, I dislike how applyingf (g * k * g⁻¹) = f g * f k * (f g)⁻¹ together with (f g)⁻¹ = f (g⁻¹) is performed in one step | 1 | level of detail | T- |
| 9 | "It is not clear in the equality chain exactly where the kernel property is used in the HumanProof proof" | 1 | level of detail | H- |
Rows 2, 4 and 7 in Table 6.11 suggest that the main reason why Lean tended to rank higher in understandability for Lemma 3 is because the syntax of Lean's calc block requires that the proof terms for each step of the equality chain be included explicitly.
Participants generally found these useful for understandability, because it meant that each line in the equality chain had an explicit reason instead of having to infer which rewrite rule was used by comparing expressions
(this is a case where the Lean proof's higher level of detail was actually a good thing rather than getting in the way).
This suggests that future versions of HumanProof should include the option to explicitly include these rewrite rules.
Rows 1 and 2 in Table 6.11 show that there is also generally disagreement on what the most understandable level of detail is in terms of the number of steps that should be omitted in the equality chain.
Now let us turn to the metric space lemmas in Table 6.12.
Table of reasons participants gave in their ranking of the understandability of proofs for Lemmas 2 and 4.
| paraphrase quote | count | category | judgement | |
|---|---|---|---|---|
| 1 | "The textbook proof of Lemma 2 is too terse" | 5 | level of detail | T- |
| 2 | "The textbook proof is what I would see in a lecture but if I was teaching I would use HumanProof" | 5 | structure, level of detail | H+ |
| 3 | Expressing shock or surprise upon seeing the Lean proof | 5 | level of detail | L- |
| 4 | "I like the use of an explicit 'we must show' goal statement in the HumanProof proof" | 3 | structure | H+ |
| 5 | "The Lean proof includes too much detail" | 3 | level of detail | L- |
| 6 | "In Lemma 2, the last paragraph of HumanProof is too wordy / useless" | 3 | level of detail, structure | H- |
| 7 | "It is difficult to parse the definition ofis_open" | 2 | syntax | = |
| 8 | "I prefer 'x ∈ A whenever dist y x < ε for all x' to '∀ x, dist y x < ε → x ∈ A'" | 2 | syntax | = |
| 9 | "In the Lean proof, it is difficult to figure out what each tactic is doing to the goal state" | 2 | structure, syntax | L- |
| 10 | "Lean gives too much detail to gain any intuition on the proof" | 2 | level of detail | L- |
| 11 | "I prefer HumanProof's justification of choosing ε, generally" | 2 | structure | H+ |
| 12 | "I prefer HumanProof's justification of choosing ε, but only for the purposes of teaching" | 2 | structure | H+ |
| 13 | "I prefer the lack of justification of choosing ε" | 2 | structure | T+ |
| 14 | "It is difficult to parse the definition ofis_open" | 2 | syntax | = |
| 15 | "I prefer '∀ x, dist y x < ε → x ∈ A' to 'x ∈ A whenever dist y x < ε for all x'" | 1 | syntax | = |
| 16 | "Knowing that the 'similarly' phrase in Textbook proof of Lemma 2 requires intuition" | 1 | level of detail | T |
| 17 | "Both HumanProof and textbook proofs of Lemma 4 are the same" | 1 | structure | H=T |
Here, most of the criticisms of Lean are on the large level of detail that the proof needs (rows 1, 2, 3, 5, 6, 10, 16 of Table 6.12). Now, to some extent the amount of detail included has been inflated by my representation of the lemma to ensure that the participants can read through the proof without having an interactive window open, so this might be more of a complaint about how I have written the proof than an intrinsic problem with Lean.
Another common talking point (rows 12, 13, 14 in Table 6.12) was the way in which HumanProof structured proofs by delaying the choice of ε to when it is clear what the value should be, rather than the Lean and Textbook proofs which choose ε up-front.
There was not agreement among the participants about which structure of proof is better.
One participant noted that they preferred proofs where 'ε is pulled out of a hat and checked later'.
Row 1 of Table 6.12 shows that participants generally struggled with the textbook proof of Lemma 2 (Appendix D.3.2).
This might be because the original proof was stated in terms of open ε-balls which I replaced with a ∀∃ expression, and this change unfairly marred the understandability of the textbook proof. This was done to ensure that the same definitions were used across all versions of the proof.
I also provide below in Table 6.13 some general remarks on the proofs that weren't specific to a particular lemma.
Table of general reasons participants gave in their ranking of the understandability of proofs that apply to all of the Lemmas.
| Paraphrase quote | count | category | judgement | |
|---|---|---|---|---|
| 1 | "I am finding Lean difficult to read mostly because I am not used to the syntax rather than because the underlying structure is hard to follow" | 6 | syntax | L- |
| 2 | "The Lean proof makes sense even though I don't know the tactic syntax well" | 5 | syntax | L+ |
| 3 | "I am getting used to reading Lean", "This is much easier now that I am familiar with the syntax" | 4 | syntax | L+ |
| 4 | "Lean really focusses the mind on what you have to prove" | 2 | level of detail | L+ |
| 5 | "In HumanProof and textbook proofs I find reading the Lean-like expressions to be difficult" | 1 | syntax | = |
The trend in Table 6.13 is syntax. Many participants were keen to state that they found the Lean tactic syntax difficult to read, but they also stated that this shouldn't be a reason to discount a proof as being difficult to understand because it is just a matter of not being used to the syntax rather than an intrinsic problem with the proof. When asked to give a reason why the Lean proof was found to be less understandable for Lemmas 2 and 4, the reason was usually about level of detail and syntax rather than about the structure of the proof. The take-home message here is that while newcomers are likely to find the new syntax of Lean strange, they are willing to learn it and do not see it as a problem with formal provers.
6.6.3. Verbal responses for confidence
When the participants gave a rating of their confidence in the correctness of the proofs, I reminded them that the Lean proofs had been verified by Lean's kernel. Looking at the numerical results in the right column of Figure 6.8 and the results of Section 6.5.3, we can see that participants are more likely to be confident in the HumanProof proofs than the Lean proofs, and more likely to be confident in the Textbook proofs over the Lean proofs (with the exception of Lemma 2). As discussed, the signal is not very strong but this suggests that knowing that a proof is formally verified does not necessarily make mathematicians more confident that the proof is correct.
Three participants volunteered that they were less certain of Lean because they don't know how it works and it might have bugs. Meanwhile one participant, after ranking their confidence in Lean lower, stated
"I can't tell if the reason I said that I am less confident was just an irrational suspicion or something else... I can't figure out what kind of mistake... in my mind there might exist some kind of mistake where it would logically be fine but somehow the proof doesn't work, but I don't know if that's a real thing or not."
This suggests a counterintuitive perspective; convincing mathematicians to have more confidence in formal methods such as provers is not a problem of verifying that a given proof is correct. Instead they need to be able to see why a proof is true.
6.6.4. Summary of verbal responses
To wrap up, in this section we have explored the evidence that the verbal responses of participants provide for the research questions laid out in Section 6.1.
What properties of a proof contribute to, or inhibit, the understandability of a proof? The most commonly given property is on signposting a proof by providing an intuition or sketch of the proof, followed by getting the level of detail right; skipping over parts of the proof that are less important while remaining easy to check. Syntactic clarity was less important.
Does having a formal guarantee of correctness increase a mathematician's confidence in the correctness of the proof? The answer seems to be no, but perhaps this will change as the mathematicians have more experience with an interactive theorem prover.
6.7. Threats to validity and limitations
Here, I list some of the ways in which the experiment could be invalidated. There are two kinds of threats: internal and external. An internal threat is one which causes the experiment to not measure what it says it is measuring. An external threat is about generalisation; do the results of the experiment extend to broader claims about the whole system?
Below I list the threats to validity that I have identified for this study.
Confounding – Some other aspect of how the proofs are presented might be causing participants to be biased towards one or the other (e.g., if one uses typeset mathematics vs monospace code, or dependent on the choice of variable names). Because of this I have changed the human-written natural language proof scripts to use Lean notation for mathematical expressions instead of . Another defence against this threat is to simply ask the participants about why they chose to rate the proofs as they did. However, it is possible that this bias is subconscious and therefore would not be picked up in the verbal responses ("I don't know why I prefer this one"...).
Selection bias – Participants are not drawn randomly from the population but are drawn from people who answer an advert for a study. This could cause a bias towards users who are more interested in ITP and ATPInteractive Theorem Proving and Automated Theorem Proving, see Section 2.1.2.. I defend against this with the question in the debrief phase asking what their prior experience is with ITP and ATP. Additionally, it is not mentioned that the HumanProof-generated proof is generated by a machine, so being biased towards ITP would cause the bias to be towards the Lean proof rather than towards the generated proof.
Maturation/ learning effects – During the course of the experiment, the participants may become used to performing the rankings and reading the two Lean-based proofs. The training phase and throwing away the results of the first task should help remove any effects from the participants being unfamiliar with the material. The lemmas and proofs are presented in a randomised order so at least any learning effect bias is distributed evenly over the results.
'Cached' scoring – Similar to maturation, participants may remember their scores to previous rounds and use that as a shortcut to thinking about the new problem presented to them. This is partly the purpose of asking the participants to explain why they ranked as they do, which should cause them to think about their rating more than relying on cached ratings.
Experimenter bias – I have a bias towards the HumanProof system because I built it. This could cause me to inadvertently behave differently when the participant is interacting with the HumanProof proof script. In order to minimise this, I tried to keep to the experimenter script as much as possible. I have also introduced bias in how I have selected the example questions. The textbook proofs were chosen from existing mathematical textbooks, but I perhaps introduced bias when I augmented them to bring them in line with the other two proofs. To some extent the Lean proofs are not representative of a Lean proof that one would find 'in the wild'. I couldn't use an existing mathlibMathlib is Lean's mathematical library. proof of the same theorem because Lean proofs in mathlib can be difficult to read without the Lean goal-state window visible and without first being familiar with the definitions and conventions which are highly specific to Lean. Although this bias may cause participants perceptions to be changed, an impression I got during the sessions was that the participants were generally sympathetic to the Lean proofs, possibly because they assumed that I was primarily interested in the Lean proof scripts as opposed to the HumanProof proof which was not declared to be computer generated.
Generalisation - The lemmas that have been selected are all elementary propositions from the Cambridge undergraduate mathematics course. This was necessary to make sure that the proofs could be understood independently of the definitions and lemmas that are required to write down proofs of later results and to ensure that the participants could review the proofs quickly enough to complete each session in under an hour. However this choice introduces a threat to external validity, in that it is not clear whether any results found should generalise to more advanced lemmas and proofs. More experiments would need to be done to confirm whether the results and responses generalise to a more diverse range of problems and participants. Do we have a strong prior reason to expect that participants would answer differently on more advanced lemmas and proofs? My personal prior is that they would rank Lean even worse, most notably because the result would rely on some unfamiliar lemmas and concepts such as filters and type coercions. I also suspect that HumanProof would perform worse on more advanced proofs, since the proofs would be longer and hence a more sophisticated natural language generation system would be needed to generate the results.
Ceiling effects - Some of the ratings have ceiling effects, where the ratings data mostly occurs around the extrema of the scale. This can be seen to occur for the understandability and confidence scores for Lemma 3.
Sample size - There were only 11 participants in the study. This low sample size manifests in the results as the fat likelihood curves in Figure 6.8. However, the study was designed to be fairly informal, with the quantitative test's purpose mainly to spark discussion, so it is not clear to me that any additional insight would be gained from increasing the study size.
6.8. Conclusions and future work
In this chapter I have evaluated the natural language write-up component of HumanProof by asking mathematicians to compare it against Lean proofs and proofs derived from textbooks. The results give different answers for equational reasoning proofs as opposed to the more structural natural language proofs and Lean proofs. This suggests that we should come to two conclusions from this experiment.
In the case of structural proofs, users generally prefer HumanProof and textbook proofs to Lean proofs for understandability. The participants reported that to some extent it was because they found the natural language proofs more familiar, but also because the Lean proofs were considered too detailed.
However the qualitative, verbal results showed (Section 6.6.2) that participants were usually sympathetic towards the Lean structure, only wishing that the proofs be a little more terse, provide signposts and hide unnecessary details.
In the wider sense, we can use the results from this study to see that mathematicians are willing to move to different syntax, but that the high-level structure and level of detail of formalised proofs needs to be improved in order for them to adopt ITP. The study confirms that producing natural language proofs at a more human-like level of detail is useful for mathematicians. It also provides some surprising complaints about how proofs are typically laid out in textbooks where a more formal and detailed approach would actually be preferred, as we saw for the group homomorphisms question, where the Textbook version of the proof was considered to be too terse.
Within the wider scope of the thesis and the research questions in Section 1.2, the study presented in this chapter seeks to determine whether software can produce formalized, understandable proofs. The study shows that HumanProof system developed in Chapter 3 and Chapter 4 can help with understandability (as shown in Section 6.5 for the case of Lemmas 2 and 4).
Bibliography for this chapter
- [IJR99]Ireland, Andrew; Jackson, Michael; Reid, GordonInteractive proof critics (1999)Formal Aspects of Computingvolume 11number 3pages 302--325publisher Springerdoi 10.1007/s001650050052https://doi.org/10.1007/s001650050052
- [MH93]Monk, Andrew; Haber, JeanneImproving your human-computer interface: a practical technique (1993)publisher Prentice Hallisbn 9780130100344https://books.google.co.uk/books?id=JN9QAAAAMAAJ
- [Sch12]Schreier, MargritQualitative content analysis in practice (2012)publisher SAGE Publicationsisbn 9781849205931https://uk.sagepub.com/en-gb/eur/qualitative-content-analysis-in-practice/book234633